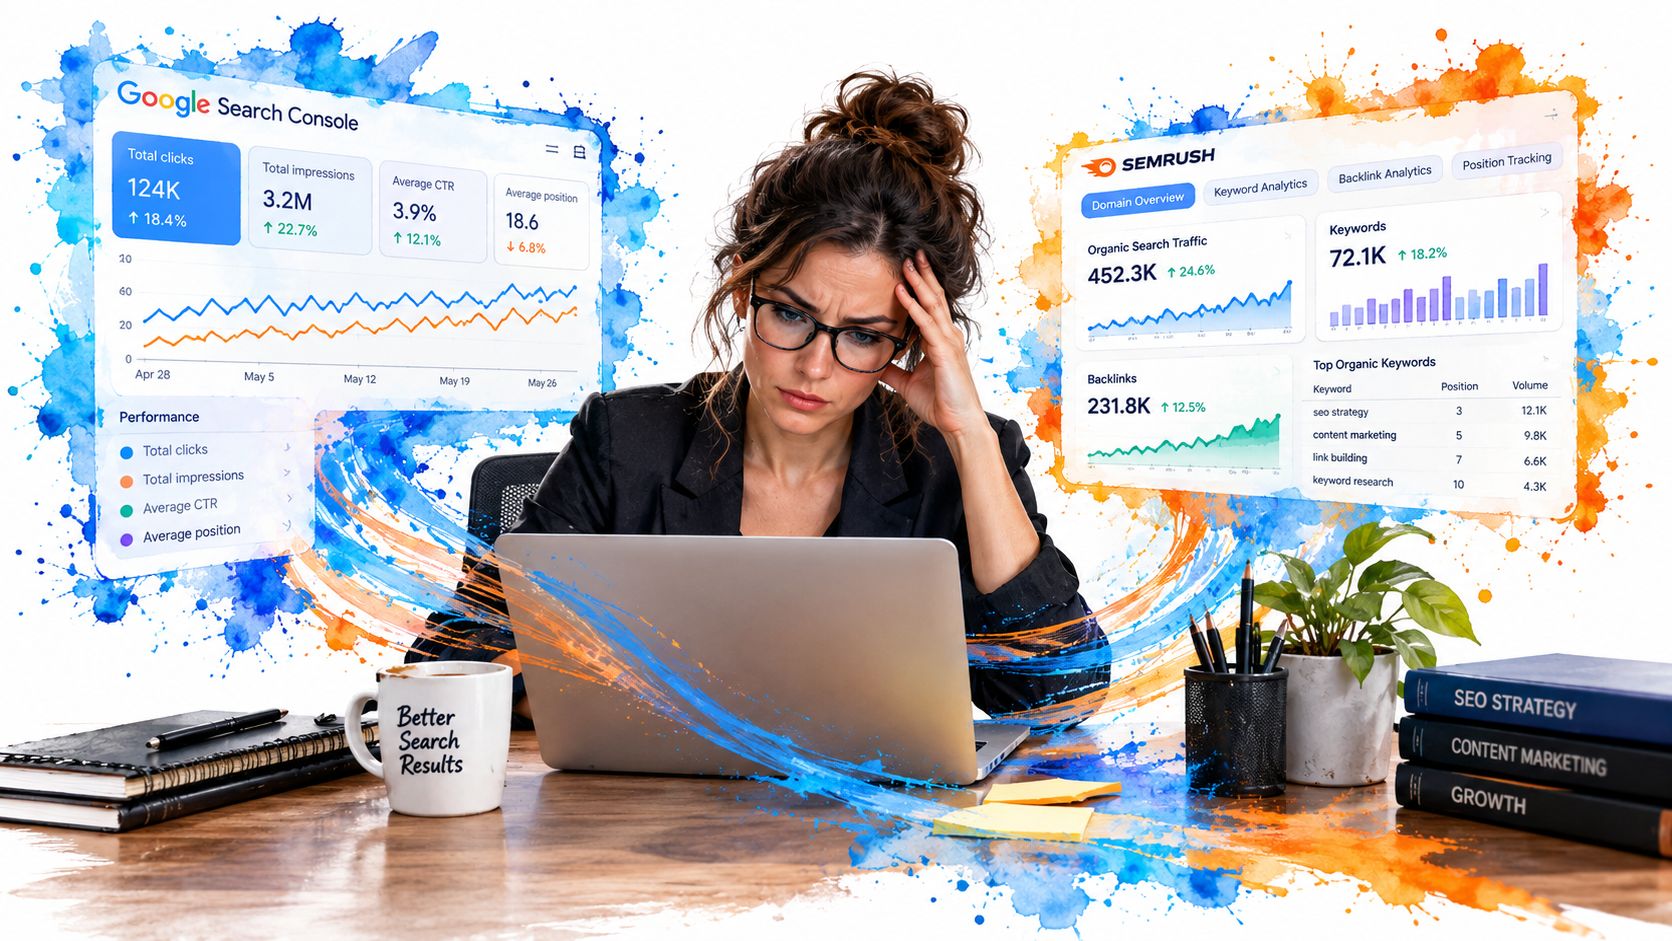
You're the senior SEO lead on Monday morning. Search Console exports are open in one tab, a Semrush snapshot in another, and GA4 is showing a traffic number that doesn't quite match either. You're checking date ranges, explaining discrepancies, copying charts into a deck, and trying to write useful commentary before the 10 a.m. client call.
By Tuesday, some of those numbers are already stale. The work has consumed the time you needed for analysis, prioritization, and execution. That's the core problem with manual reporting: it turns a recurring signal into a recurring project.
SEO automated reporting fixes the extraction problem, not the judgment problem. A well-designed system collects current data, standardizes it, checks for errors, and routes meaningful changes into the next action. You should automate the repetitive assembly. You should keep interpretation, approval, and prioritization human-reviewed.
Table of Contents
- The Monday Morning Reporting Grind
- What Automated SEO Reporting Actually Means
- Core Metrics a 2026 Report Should Track
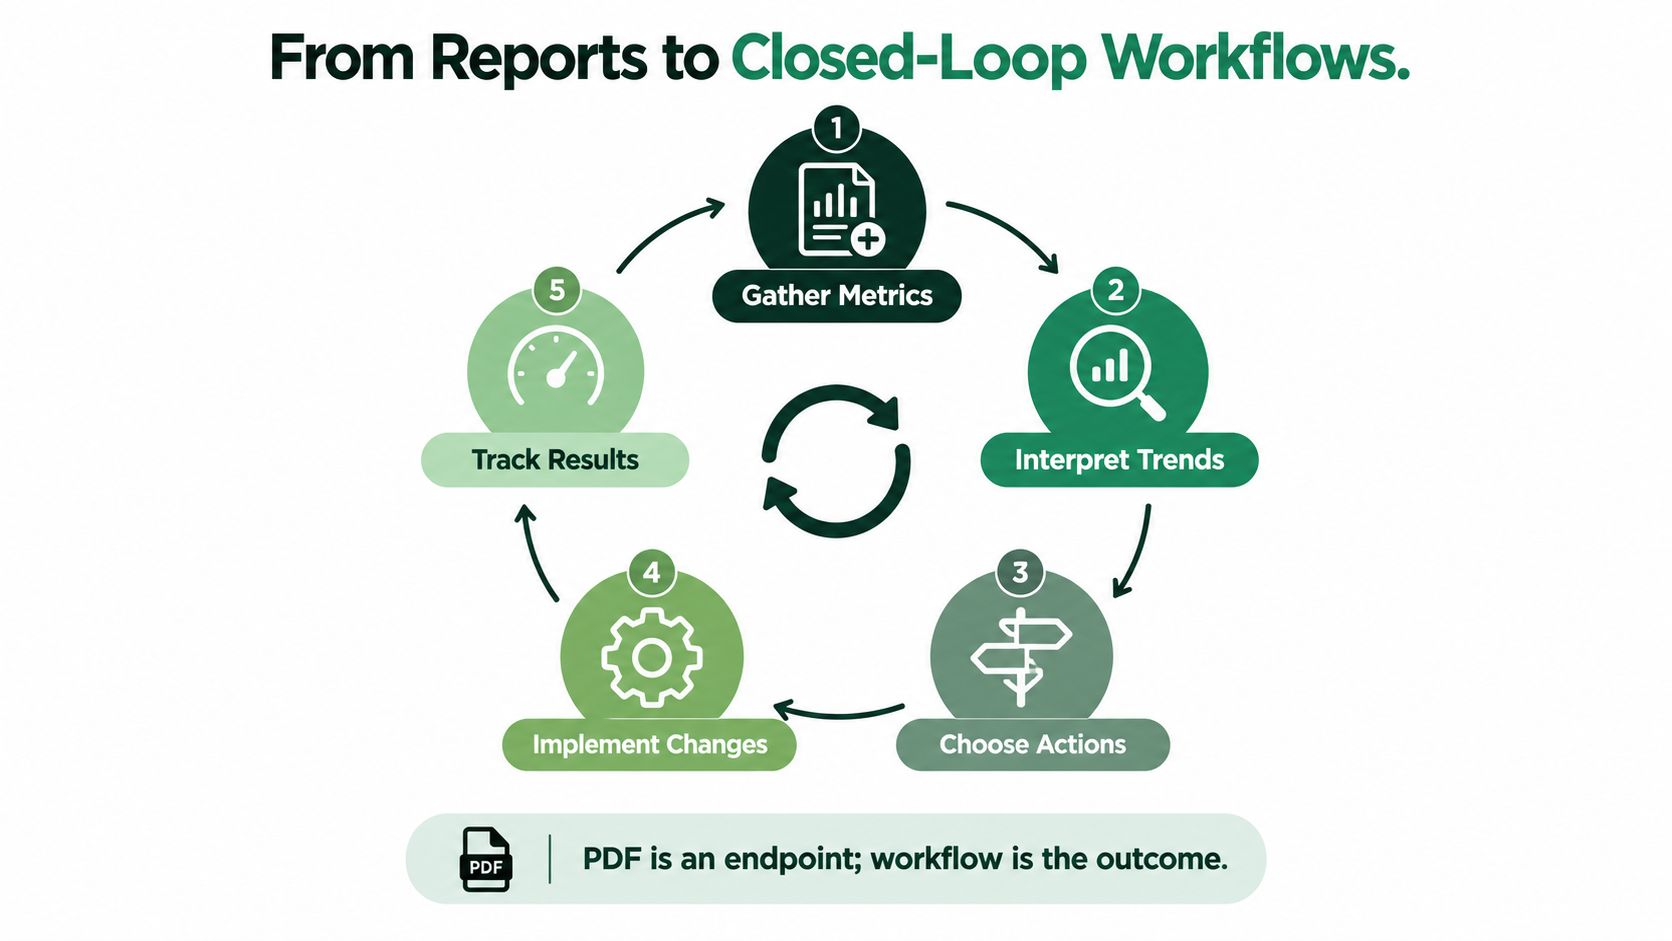
- From Reports to Closed-Loop Workflows
- Implementation Patterns That Hold Up
- Common Pitfalls and How to Avoid Them
- Your 30-Day Starter Plan and Maturity Ladder
The Monday Morning Reporting Grind
The grind usually starts with a spreadsheet that was supposed to be temporary.
You export clicks and impressions from Google Search Console, download a rank snapshot from Semrush or another tracker, open GA4 to check organic sessions and conversions, then compare landing-page totals across systems. The numbers don't line up because each platform uses different definitions, attribution rules, filters, or processing windows. You spend the next hour deciding which discrepancy is meaningful and which is just a reporting artifact.
Then comes the deck. Charts need formatting, commentary needs updating, and last month's labels need replacing. A client wants branded and non-branded traffic separated. An executive wants revenue. A developer wants the technical issue list without the narrative. Everyone receives a variation of the same manual production work.
Reporting becomes the work
Manual extraction creates three operational costs:
- Context switching: You move between analytics, rank tracking, crawling, spreadsheets, presentation software, and email instead of staying with the business question.
- Reconciliation overhead: You repeatedly explain why Search Console clicks, GA4 sessions, and conversion reports aren't identical.
- Decision delay: A problem discovered during report assembly may already have changed by the time someone acts on it.
A report built once a month also encourages the wrong behavior. The team treats reporting day as the moment SEO performance becomes visible, even though rankings, indexation, traffic, and technical health have been changing continuously.
Operational rule: If a human has to export, rename, paste, format, and resend the same data every cycle, the process is a workflow failure, not a sign of analytical rigor.
The control-loop shift
Automated reporting changes the unit of work. Instead of rebuilding a report, the system runs a pipeline. It collects data from connected sources, applies known transformations, refreshes the reporting layer, and surfaces exceptions for review.
This doesn't mean removing people. A senior SEO lead should spend Monday deciding why a priority page lost visibility, whether a technical issue deserves immediate escalation, and which content update belongs in the next sprint. They shouldn't spend Monday repairing a spreadsheet.
The state of AI and automation in SEO survey found that 87% of SEO teams use AI regularly in core workflows, while only 1% describe their work as fully automated. The same survey reports that teams with AI central to delivery saved 7 or more hours per week 81% of the time, compared with 11% of teams still testing AI. The lesson is clear. Adoption matters, but workflow integration creates the practical value.
What Automated SEO Reporting Actually Means
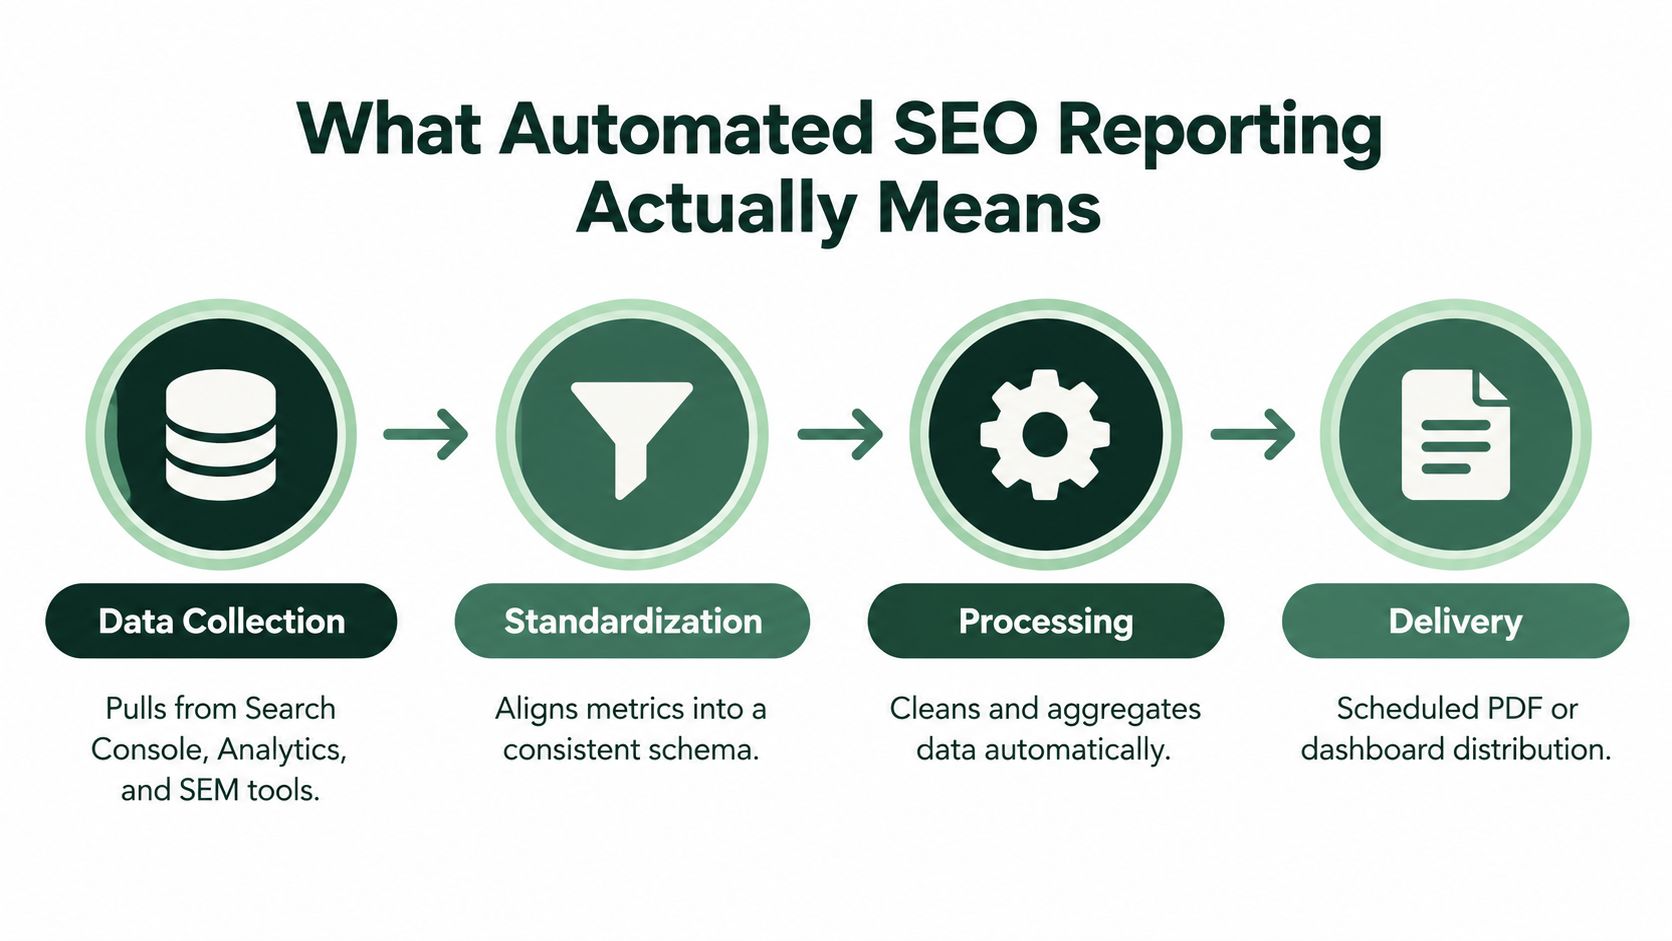
Automated SEO reporting is a scheduled data pipeline. It pulls information from search, analytics, technical, content, and link systems, converts that information into a consistent structure, and delivers the result through a dashboard, email, Slack, PDF, or API without someone running exports manually.
Think of the difference between a live taxi meter and a handwritten receipt. The meter records the journey as it happens, using a defined calculation. The receipt reconstructs the journey after the fact, often from memory and scattered notes. Automated reporting should work like the meter.
The four moving parts
1. Data sources
Connect the systems that answer different parts of the SEO question:
- Google Search Console for clicks, impressions, CTR, queries, and pages.
- GA4 for organic sessions, engagement, events, and conversions.
- Rank trackers for selected keyword movement and competitor visibility.
- Crawlers for crawlability, indexability, redirects, broken links, and structured data.
- Server logs and render data for crawler behavior and response patterns.
- Content and publishing systems for pages shipped, updates, and internal-link changes.
- Backlink tools for new, lost, and changed referring domains.
Use APIs or structured exports whenever possible. Screenshots are not data. They can't be filtered, compared, validated, or reused by the next stage.
2. Scheduling
A scheduler determines when each source refreshes. That might be a platform-native trigger, a cron job, or a workflow orchestrator. The schedule should reflect the metric's decision value. Technical incidents need faster detection than content decay, and content production doesn't need the same cadence as uptime monitoring.
3. Standardization
This layer maps different systems into shared definitions. It handles field names, URL formats, date windows, brand segmentation, currency, device groupings, and attribution conventions. Without standardization, a dashboard can look unified while comparing incompatible measures.
For teams evaluating external data collection for competitive research or specialized sources, a web scraping API comparison can help clarify which providers support structured extraction, refresh controls, and usable output formats.
4. Processing and delivery
Processing cleans, joins, aggregates, and compares the data. Delivery then puts the result where each audience already works. A client may need a branded PDF or live link. An SEO operator may need an alert. A product team may consume JSON. An executive may need a short trajectory summary.
The technical value is more than convenience. Centralized ingestion reduces the reconciliation errors created when teams export rankings, traffic, conversions, and backlinks separately. Reporting becomes a control loop that detects movement, adds context, and feeds the next operating decision.
Core Metrics a 2026 Report Should Track
A useful report doesn't maximize the number of charts. It makes the relationship between visibility, technical access, content supply, and business outcomes easy to inspect.
The report should separate four metric buckets. Each bucket answers a different operational question, and combining them into one blended score usually hides the cause of change.
Four metric buckets in a 2026 SEO report
| Metric Bucket | What It Measures | Primary Sources | Decision It Supports |
|---|---|---|---|
| Organic performance | Search demand captured, landing-page engagement, and business outcomes | Search Console, GA4, CRM, rank tracker | Which pages, queries, and segments deserve investment |
| Technical health | Whether search engines can crawl, interpret, and index the site | Crawler, Search Console, Core Web Vitals, server logs | Which defects need remediation and escalation |
| Content output | What the team published, updated, linked, and allowed to decay | CMS, editorial system, link database, analytics | Whether production activity matches the strategy |
| AI visibility | Brand inclusion, citations, entities, and sentiment in generative answers | AI-answer monitoring, prompt sets, competitor tracking | How to improve discovery beyond traditional result pages |
Organic performance needs a business anchor
Clicks, impressions, CTR, and average position remain useful diagnostic signals. They aren't sufficient as the headline. Add landing-page-level conversions, assisted conversions, and revenue or pipeline where the measurement setup supports it.
A page can gain impressions while attracting weak intent. A keyword can improve in position while producing little commercial value. The report should therefore show movement by landing page, query group, brand status, and conversion path, not just aggregate organic traffic.
The SEO progress report guide is useful when deciding how to connect performance movement with work completed and next actions.
Technical health explains blocked opportunity
Track crawl coverage, indexability, Core Web Vitals, structured-data validity, redirect behavior, and log-file response patterns. These measures tell operators whether the site can support the visibility strategy.
A traffic decline and an indexation problem require different responses. So do a ranking drop caused by content competition and a ranking drop caused by a broken canonical. Technical metrics earn their place when they change the response, not because they make the report look thorough.
For adjacent deliverability checks, teams can use a free inbox placement test when email delivery is part of the reporting or alerting workflow. It is not an SEO KPI, but it can help verify that automated stakeholder updates reach their recipients.
Content output supplies the explanation
Report pages shipped, substantial updates, internal-link changes, and decay on existing URLs. Without those fields, the report describes demand but not the team's intervention.
Many dashboards can become misleading. Traffic can rise because of seasonality, brand activity, or competitor weakness. A work log gives the analyst evidence to compare against the timing and location of performance movement.
AI visibility is now a required bucket
AI visibility should measure share of voice in generated answers, citation frequency, entity coverage against competitors, prompt-level sentiment, and inclusion across systems such as ChatGPT, Perplexity, Gemini, and Google AI Overviews.
The AI visibility reporting coverage identifies a major gap in current reporting products. It notes that Google AI Overviews appeared in over 13% of searches in mid-2025, up from 6.5% in January 2025, making generative discovery a practical measurement concern rather than a specialist experiment.
A report that tracks only rankings and sessions is still useful, but it is incomplete. It measures the search environment that existed before answer engines became a meaningful discovery surface.