You run PageSpeed Insights, see a decent lab score, ship a redesign, and then Search Console lights up with poor URLs anyway. That's the Core Web Vitals trap many teams hit. The page looked fast on a developer laptop, but real users on mobile networks, older devices, and long browsing sessions saw something else.
I've seen this most often on Shopify product pages and WordPress marketing pages. Teams obsess over image compression, shave a bit off Lighthouse, and still fail because the bottleneck sits at the template level: a slow hero render, unstable promo blocks, or JavaScript that locks the main thread after the page appears usable. If you want to know how to improve Core Web Vitals, start by treating them as a field-data problem, not a score-chasing exercise.
Table of Contents
Why Core Web Vitals Still Decide User Experience and Rankings
A redesign goes live. Product pages look sharp, the hero loads fast on office Wi-Fi, and the launch review passes. Two weeks later, organic landing pages still feel slow for shoppers on mid-range phones, faceted collections lag after a few taps, and Search Console keeps clustering key templates under poor URLs. That is why Core Web Vitals still matter. They measure the experience people get, across real devices and real sessions.
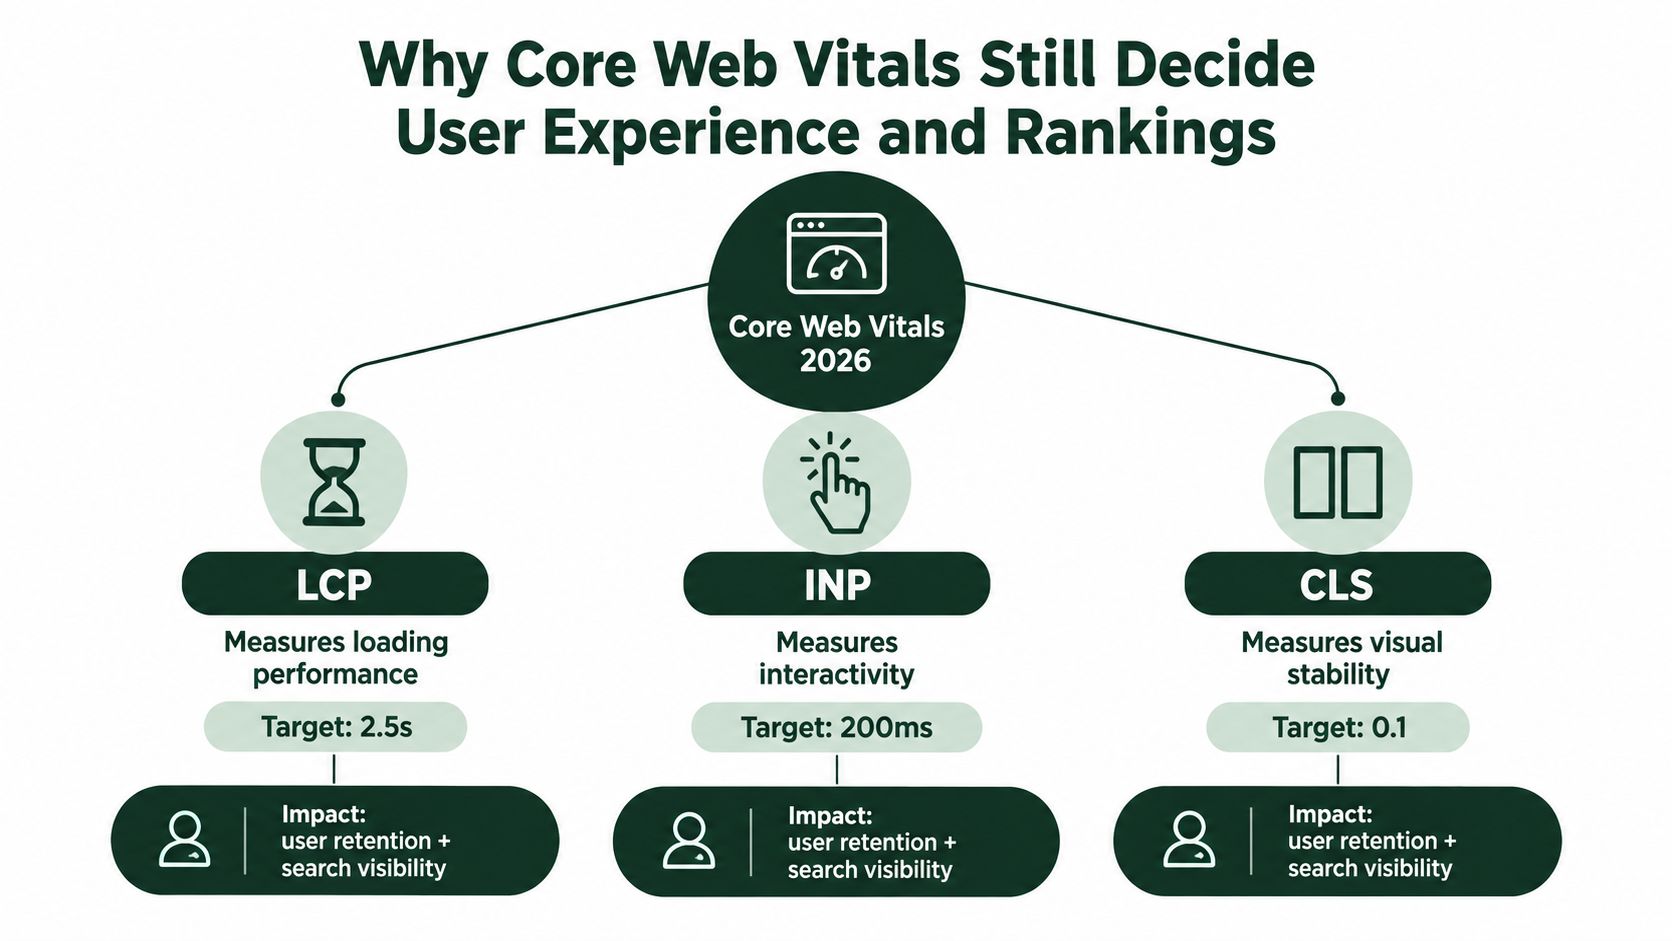
Google still uses Core Web Vitals as part of its page experience evaluation for Search, and the standard is based on real-user performance collected over time, not a single synthetic run, as described in its Core Web Vitals documentation. The thresholds teams work against are unchanged in practice: LCP at 2.5 seconds or less, INP at 200 milliseconds or less, and CLS at 0.1 or less.
What each metric actually catches
LCP measures when the main content becomes visible. On Shopify, that is often the product gallery, hero image, or featured collection media. On WordPress, it is commonly the hero block, banner image, or a heavy slider that looked fine in staging and turns into the slowest render step in the field.
CLS measures visual instability after rendering starts. Late cookie banners, injected promo bars, ad containers without reserved space, and font swaps still cause a lot of avoidable movement. Users do not care which script caused it. They care that the button jumped as they tried to tap it.
INP catches the failures many guides still underplay. Google replaced First Input Delay with INP in March 2024, and web.dev's INP documentation reflects the shift from first-input timing to full-session responsiveness. This matters on interaction-heavy templates: collection filters, variant pickers, mini-cart drawers, sticky headers, search overlays, and SPA route changes. A page can post an acceptable LCP and still feel broken once someone starts using it.
That trade-off shows up all the time. Teams trim image weight, improve load metrics, and then leave long JavaScript tasks, third-party widgets, and re-render-heavy components untouched. Field data stays bad because the bottleneck is interaction cost at the template level.
Why rankings discussions often miss the operational problem
Core Web Vitals are rarely the only reason a page underperforms in search, but they still decide whether the experience is consistently acceptable for a large share of users. That is the practical frame to use. If you want wider context on ranking signals, this guide on how Google ranks your site is a useful reference.
The useful workflow is simple. Find which templates drive the largest volume of poor visits. Fix the bottlenecks those templates share. Then verify the gain in field data instead of declaring success from a lab score.
That approach is what moves results on real sites. Homepages get attention, but category pages, product templates, blog archives, and app-heavy account flows usually decide whether a site passes Core Web Vitals at scale.
How to Audit Core Web Vitals the Right Way
A familiar failure pattern looks like this: a team sees a poor Lighthouse score on the homepage, spends a sprint compressing images and trimming CSS, then checks Search Console a month later and finds the worst URLs are still collection pages, product templates, or logged-in account flows. The audit failed before the fixes started because the wrong pages and the wrong metric got priority.
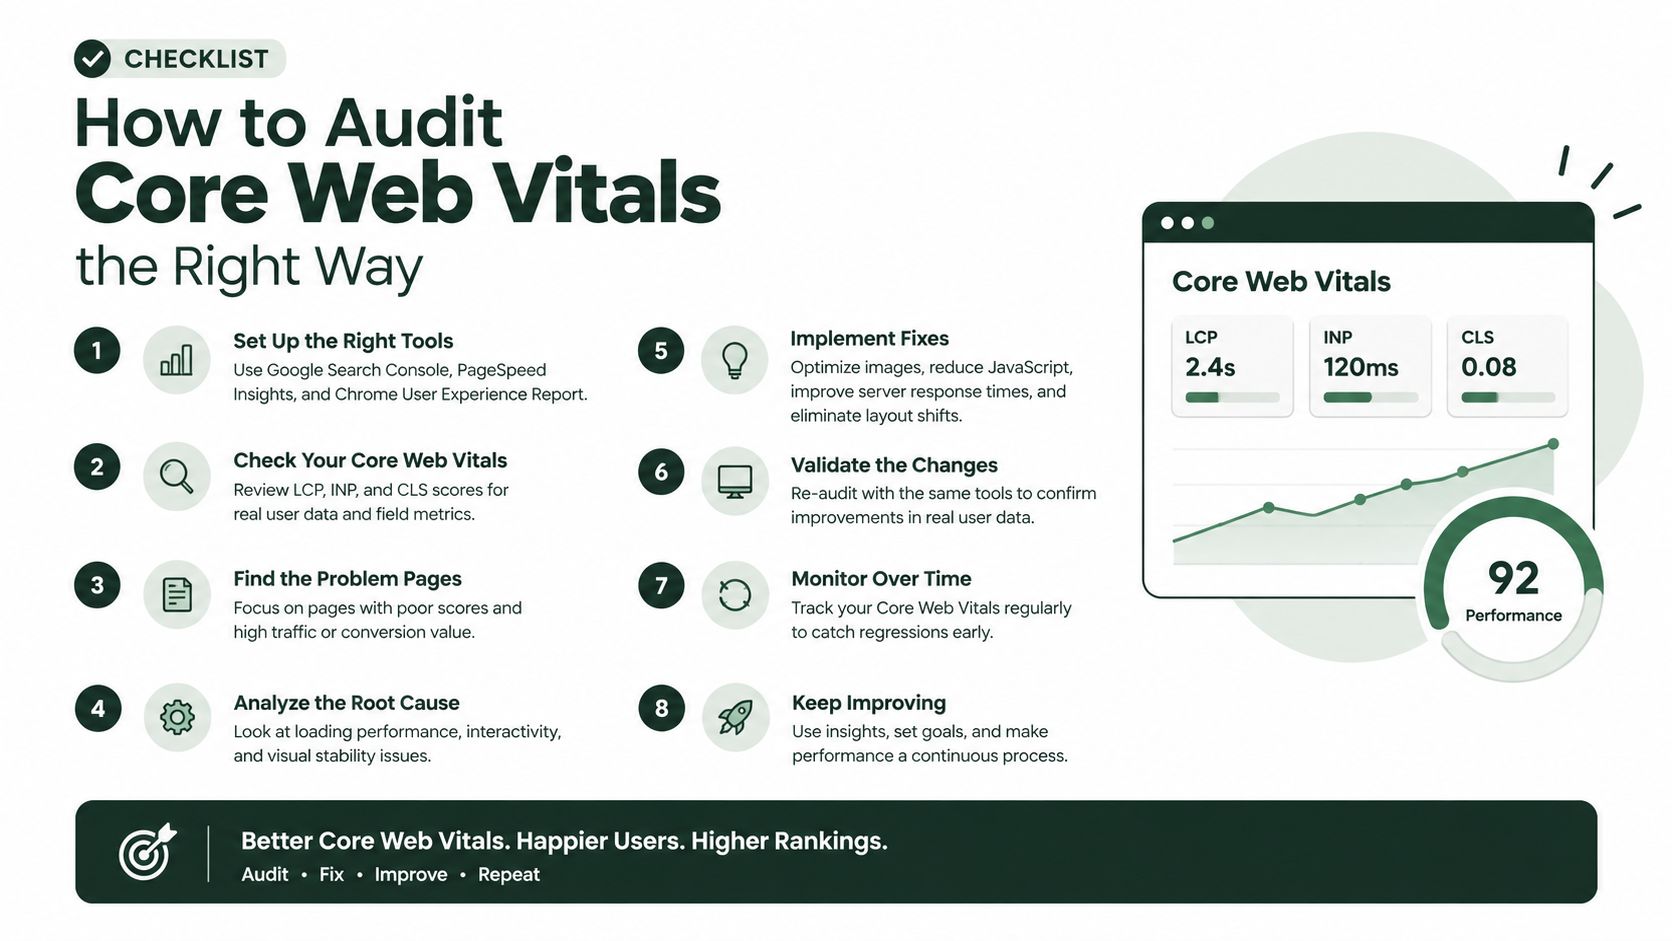
Start with field data. Use lab tools to explain it.
Start with field data, not Lighthouse scores
Google assesses Core Web Vitals from real-user traffic over time, not from a single local test. Lighthouse is still useful, but only after you know which pages, templates, and metrics are failing in the field.
Use the tools in this order:
- Search Console Core Web Vitals report to find failing page groups and spot whether the problem is widespread or isolated.
- PageSpeed Insights to check whether a specific URL has field data and to compare field results with lab behavior.
- CrUX-based tools to review origin and URL-level trends.
- Lighthouse and WebPageTest to reproduce the issue, inspect the waterfall, and see what is blocking rendering or tying up the main thread.
If you already run broader technical reviews, fold Core Web Vitals into a wider SEO audit process that covers templates, crawling, and deployment risks. Performance issues rarely stay isolated for long on either WordPress or Shopify.
Segment by template before you touch code
Sitewide averages hide the pages that hurt field data. On Shopify, product pages often carry app embeds, variant logic, upsell widgets, and review scripts that the homepage never loads. On WordPress, archive pages, ad-heavy articles, and builders can behave very differently from a plain content page.
Group the audit by:
- Template type such as homepage, product, collection, article, landing page, cart, and account area
- Device class because mobile usually exposes CPU and network limits first
- Geography when consent tools, CDNs, and third-party tags vary by region
- Journey stage because many INP failures appear after load, during filtering, search, cart updates, or route changes
I usually want one answer before any engineering work starts: which template family is responsible for the largest share of poor visits?
A simple table is enough to keep the audit grounded:
| Template |
Likely failing metric |
Common cause |
| Product page |
LCP or INP |
Heavy media, variant scripts, review apps |
| Collection page |
INP |
Filter logic, faceted search, SPA transitions |
| Blog post |
CLS |
Late embeds, ad slots, newsletter bars |
| Landing page |
LCP or CLS |
Hero video, slider, web fonts, A/B scripts |
Know which metric is blocking improvement
Many teams assume LCP will be the answer. It often is, but that assumption misses a lot of expensive mistakes.
If poor visits cluster around faceted navigation, search overlays, cart drawers, account dashboards, or client-rendered route changes, check INP first. I see this often on Shopify stores with aggressive app stacks and on WordPress builds that rely on page builders plus layered plugins. The page can load in an acceptable window and still feel slow because every interaction triggers heavy JavaScript work.
CLS needs the same discipline. Editorial pages, affiliate layouts, and monetized templates can pass load metrics and still fail because ad slots, embeds, cookie bars, and font swaps keep shifting the page after first paint.
Audit each major template cluster on its own. Do not blend homepage, article, collection, and product behavior into one average and call that the site's score.
The audit moves faster when each tool has a clear role:
- Search Console for pattern detection across page groups
- PageSpeed Insights for URL-level field data and a quick metric mix
- Lighthouse for render-blocking resources, long tasks, and JavaScript cost
- WebPageTest for waterfalls, filmstrips, repeat tests, and scripting key flows
- AutoSEO's Core Web Vitals checker for a quick CrUX-based read on LCP, INP, and CLS before fixes get added to a larger technical workflow
For SPA and interaction-heavy templates, run tests that match real use. Load the page, open filters, change a variant, add to cart, open the mini-cart, and move between views. A clean initial page load does not clear an interface that freezes during use.
A good audit ends with a short, usable brief: which templates fail, which metric drives the failure, what component is the likely cause, and how you will verify the fix in field data after release.
Proven Ways to Speed Up Largest Contentful Paint
A familiar pattern shows up in audits. The team compresses images, turns on WebP, and expects LCP to fall. Field data barely moves because the delay sits earlier in the chain: slow HTML, blocking CSS, a heavy theme, or storefront scripts competing with the hero.
That is why I triage LCP in order of field impact. Start with what delays the first useful server response and the first paint on the templates that fail. Then work down to the LCP asset itself. On Shopify and WordPress, that order saves time because template-level bottlenecks usually outweigh one-off image tweaks.

Fix server response before you optimize pixels
If the initial HTML arrives late, the browser cannot discover the hero image, critical CSS, or above-the-fold text soon enough. LCP gets capped before asset optimization has a chance to help.
On WordPress, the usual causes are easy to spot once you profile a slow template: uncached page generation, plugin queries, bloated themes, and fragments that bypass cache. On Shopify, the platform is rarely the whole problem. The drag often comes from app embeds, Liquid loops, personalization layers, and storefront code that keeps growing release after release.
Focus on changes with broad template impact:
- Tighten caching rules so repeat views and anonymous traffic do not rebuild the same page unnecessarily.
- Use CDN delivery well for static assets and any cache-friendly HTML responses your stack allows.
- Remove theme, plugin, and app weight that adds server work or injects storefront code without a clear revenue case.
- Audit dynamic sections such as recommendations, geolocation, and review widgets, because they often slow the response before rendering even starts.
LCP is still the metric that many teams fail first in practice. It is also one of the few metrics where a single template fix can lift a large share of URLs at once, especially on collection pages, product pages, and ad-heavy article layouts.
Reduce what blocks the browser from painting
Once the server responds fast enough, look at the critical rendering path. Page builders, theme frameworks, and convenience scripts do quiet damage here.
A hero section should not wait behind five stylesheets, a slider library, icon fonts, and three marketing tags. Yet that is common on both platforms. I see it on WordPress builds where one visual builder ships global CSS and JavaScript to every template, and on Shopify stores where multiple apps each add their own bundle to the storefront.
The fixes are rarely glamorous, but they work:
- Inline only the CSS needed for above-the-fold layout and typography.
- Defer or delay non-critical JavaScript so rendering happens before enhancements.
- Replace rotating hero sliders with a static image or text block unless the slider proves its value.
- Remove third-party tags that sit on the render path but do not change business outcomes.
- Split template assets so a blog page does not load product-gallery code, and a product page does not load article widgets.
For teams pairing speed work with crawlability and template cleanup, these technical SEO best practices are a useful companion to the performance audit.
Prioritize the actual LCP element
A lot of lost time comes from optimizing the wrong image. Confirm the LCP candidate first, then make that one asset easy to discover, request, and paint.
For many sites, the LCP element is not even an image. It can be a headline block, a banner with background-image CSS, or a featured product module. The fix depends on the element type, which is why blanket advice often misses.
For hero images and primary media, the usual wins are:
- Serve responsive sizes so mobile devices are not pulling desktop assets.
- Use modern image formats where your CMS or CDN supports them cleanly.
- Preload selectively for the true hero image or the font that determines the visible headline.
- Set fetch priority on the main content image when that image is the clear LCP candidate.
- Do not lazy-load above-the-fold media.
If the hero is applied through CSS, check whether the browser discovers it too late. If the main heading depends on a web font, test whether font loading is delaying visible text enough to become the LCP issue. If the LCP element sits inside a client-rendered component, the JavaScript path may matter more than image compression.
If the largest visible element sits above the fold, don't hide it behind a lazy-loading pattern designed for below-the-fold media.
A good walkthrough on diagnosing this in Chrome and field tools is worth watching before you start pushing changes:
Validate without trading one problem for another
LCP improvements can backfire. I have seen teams preload too many assets and increase contention, move the hero into client-rendered UI and delay paint, or strip scripts so hard that content flashes in late and creates stability issues.
Use a simple validation loop after each release:
| Check type |
What you're looking for |
| Lab validation |
Earlier discovery of the LCP candidate, a shorter render path, and fewer blocking requests on the failing template |
| Field validation |
Template-level LCP improvement over time, with no new CLS or INP regression after release |
The strongest case studies follow that pattern. Renault's published results on web.dev show what sustained, targeted work can do when the team fixes the bottleneck instead of chasing broad page-speed scores: Renault's Core Web Vitals case study.
That discipline matters even more on SPA and interaction-heavy builds. A faster first paint is useful, but it does not clear a product page that re-renders the hero, gallery, or summary module after every variant change. Treat LCP as part of a closed loop: identify the failing template, fix the bottleneck that moves field data, ship, then verify the result in real-user monitoring.
Fixing Layout Shifts and Interaction Delays for Good
A common failure pattern looks like this. The homepage loads fast enough to satisfy a dashboard screenshot, then the product page shifts when reviews and upsells mount, and the filter tap on collection pages stalls because the browser is still chewing through hydration and third-party code. Field data stays poor even after image compression, preload tuning, and other LCP work.
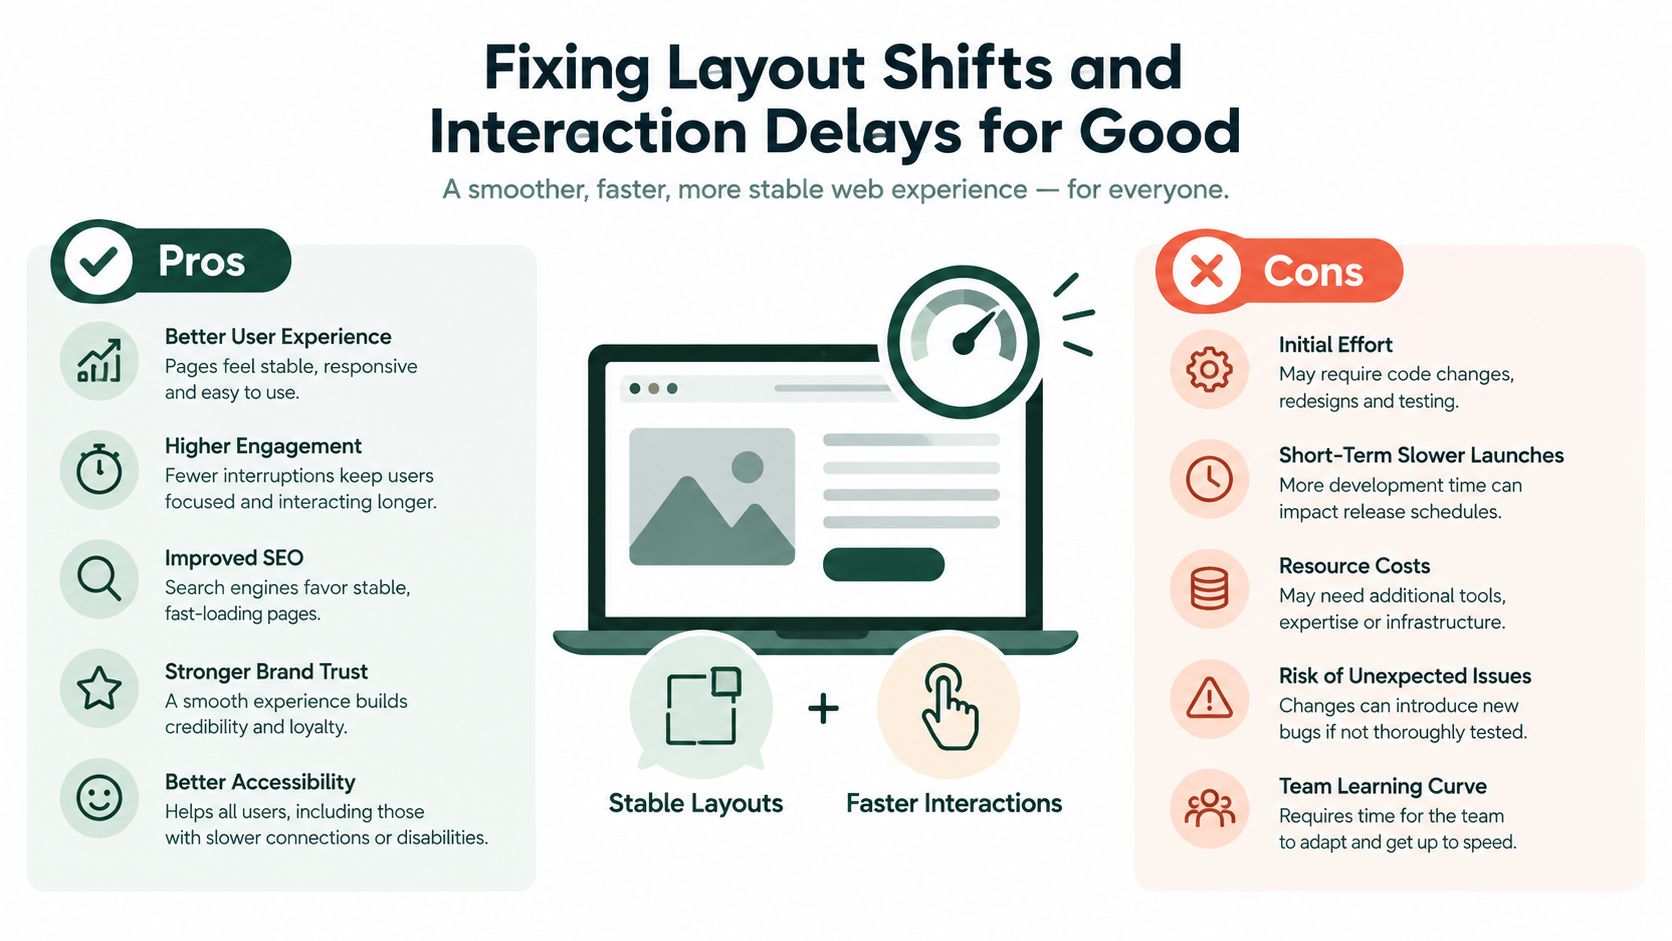
That is why CLS and INP need their own pass at the template level. On many Shopify and WordPress builds, they are the metrics that decide whether the site feels controlled or frustrating after the first paint.
Fix CLS by reserving space before content arrives
CLS usually comes from late decisions in the layout. The browser renders one version of the page, then images, embeds, app blocks, fonts, or promo UI force it to render a different one. Users feel that as a jump, and the worst offenders tend to repeat across a whole template.
Start with the elements that shift above the fold or near the user's focal area:
- Set explicit width and height for images and media containers.
- Reserve space for ads, embeds, reviews, and app blocks even when the content arrives later.
- Handle font loading carefully so headline swaps do not reflow the page.
- Insert dynamic UI below stable content where possible instead of above the header, hero, or product summary.
On WordPress, I usually find the same sources first: newsletter bars, related-post widgets, ad slots, cookie banners, and embedded video wrappers. On Shopify, it is often review widgets, trust badges, sticky add-to-cart bars, shipping notices, and upsell blocks injected by apps after the template has already painted.
The trade-off is simple. Reserving space can leave temporary blank areas if an ad or widget fails to load. In practice, that is far less damaging than letting the whole viewport jump. Stable layout tends to win in both usability and conversion paths.
Fix INP by reducing main-thread work
INP failures are less visible in a static screenshot, which is why teams miss them. The page looks loaded, but a tap on a variant picker, menu, filter, or search input waits behind JavaScript work that should have finished earlier or should not run on that interaction at all.
The usual causes are predictable:
- Long tasks that block the main thread for too long.
- Hydration overhead on React, Vue, and similar setups where the UI appears before it can respond quickly.
- Third-party scripts that attach listeners, mutate the DOM, or run expensive logic after load.
- Event handlers that trigger too much work on click, input, route change, or state update.
I have seen product pages fail INP because one variant change rebuilt the gallery, price block, inventory message, installment widget, and analytics listeners in the same interaction. The fix was not one magic setting. It was cutting the work inside that path, delaying non-user-facing updates, and removing app code that kept re-binding on every state change.
A practical workflow for INP debugging looks like this:
- Reproduce the slow interaction on the failing template, not just the initial page load.
- Record a performance trace around the delayed tap or click.
- Check whether the time went to scripting, style and layout recalculation, rendering, or a chain of async tasks.
- Break up long tasks, defer non-essential work, and simplify what the interaction triggers.
Poor INP often starts before the user clicks. The browser is still busy with work scheduled earlier.
Why SPAs need a different debugging mindset
Interaction-heavy sites and SPAs break the assumptions in many older CWV guides. The problem is not always the first load. It is the soft navigation to a collection view, the filter drawer opening, the account panel switching tabs, or the cart updating after a bundle selection.
That changes what to inspect. A filmstrip of the initial load will not explain a route transition that feels slow because the app fetched too much data, re-rendered too much UI, or blocked input during client-side state updates. Teams need traces for those interactions, plus field monitoring segmented by template or route type.
Recent coverage noted that Google expanded soft-navigation support in CrUX for single-page apps and gave TTFB more visibility in diagnostics without turning it into a ranking signal, according to Web Vitals Tools coverage of the 2026 update. That matters because SPA teams can no longer treat poor field data as a page-load-only issue. Soft navigations and delayed interactions are part of the experience users report.
Use TTFB as a clue. If a route change drags, the backend may be slow. The app may be overfetching. The browser may be blocked after the response arrives. The trace decides which one you fix.
What does not usually solve the real problem
Some fixes sound productive but rarely move field data on their own:
| Misstep |
Why it disappoints |
| Reducing one large image to fix INP |
INP failures usually come from main-thread work, not image bytes |
| Turning on lazy loading everywhere |
Above-the-fold lazy loading can hurt LCP and does not remove interaction stalls |
| Chasing total JS size alone |
Smaller bundles help, but execution timing and handler complexity often matter more |
| Fixing CLS in one browser only |
Real users trigger shifts across devices, sessions, and extension-heavy environments |
The goal is repeatable behavior on the templates that fail in the field. Reserve space before dynamic content arrives. Keep interaction paths short and predictable. Then verify the result in real-user monitoring, because a theme tweak that helps one metric can still hurt another.
Your Prioritized Execution Plan and Continuous Monitoring
Teams don't fail because they lack fixes. They fail because they apply them in the wrong order, across the wrong templates, and then stop monitoring before field data catches regressions.
The practical system is simple. Prioritize by share of poor visits, template importance, and implementation effort. A product template that drives revenue and fails LCP for a large share of mobile users belongs above a low-traffic blog template with a mild CLS issue.
Use a prioritization matrix that reflects real impact
A lightweight decision grid keeps performance work from turning into random cleanup:
- High impact, lower effort means things like adding explicit dimensions, fixing a lazy-loaded hero image, or removing one bad third-party script.
- High impact, higher effort includes theme refactors, server response improvements, SPA hydration changes, and template redesigns.
- Lower impact, lower effort covers cleanup that's worth batching but not escalating.
- Lower impact, higher effort usually waits unless it blocks a key journey.
I like to track this at the template level, not as a giant sitewide backlog. Homepage, product, collection, article, and cart each get their own owner, baseline, and validation check.
Turn findings into a repeatable workflow
A lot of SEO and development teams drift apart. SEO identifies poor URLs, engineering wants reproducible traces, and nobody owns post-deploy validation. A closed loop fixes that.
For teams that want one queue for technical issues, publishing, and follow-up measurement, AutoSEO can sit inside that process once, as a factual option. It offers a technical SEO audit with a prioritized task queue, publishing integrations, and weekly digests, which is useful when Core Web Vitals work needs approval and tracking alongside broader SEO tasks.
If you want another directory-style reference point for performance tooling categories, Siteoptimize Org on IndieTool is worth browsing for context on where CWV-focused tools fit in a broader stack.
Monitor on the same cadence as field data
Core Web Vitals improvements don't confirm overnight in field reporting. That's why teams need both immediate regression checks and longer-horizon review.
Use this rhythm:
Before deploy
Check the target template in Lighthouse or WebPageTest and confirm the intended change.
Right after deploy
Verify that you didn't create an obvious regression in layout, rendering order, or interaction behavior.
Over the next reporting window
Watch field data trend at the template or page-cluster level.
On every release cycle
Re-test the known sensitive templates, especially product pages, collection pages, and SPA flows.
Performance work sticks when every deploy has a regression check. It slips when validation happens only after someone notices a ranking drop or a broken page.
Match monitoring to modern app behavior
Interaction-heavy pages need scenario-based monitoring. Don't stop at “page loaded.” Test opening filters, switching variants, navigating between panels, adding to cart, and using search overlays. Soft navigations deserve the same scrutiny as full page loads.
TTFB can still help as a diagnostic signal on these flows, but it doesn't replace tracing the actual interaction path. When monitoring matches the way users browse, the fixes you ship are much more likely to improve the field data that Google records.
Keep Your Gains and Prevent Future Regressions
The teams that keep good Core Web Vitals don't treat performance as a one-time sprint. They build a maintenance loop around templates, assets, scripts, and releases. That's the difference between a short-lived improvement and a durable one.
If you want a practical next month plan for how to improve Core Web Vitals, keep it tight:
- Audit the worst template clusters first using field data.
- Fix one primary bottleneck per template instead of scattering effort across dozens of minor issues.
- Set rules for new assets and scripts so editors, app owners, and marketers don't reintroduce the same problem.
- Re-check after every deploy on the templates that historically regress.
For Shopify stores, that usually means stricter app governance, disciplined media handling, and regular checks on product and collection templates. For WordPress sites, it usually means theme restraint, plugin audits, and tighter control over embeds, ad slots, and page-builder output.
Core Web Vitals work pays off when you can show two things at once: users get a smoother experience, and the pages that matter stop falling into poor field-data buckets. That proof comes from consistency, not heroics.
If you want a single place to audit issues, queue fixes, publish updates, and track whether field data improves, AutoSEO is built for that workflow. It's especially useful when Core Web Vitals work touches both SEO and development, because the tasks, approvals, and measurement live in one system instead of getting scattered across tools.