Organic search generated an average of 33% of overall website traffic across seven key industries in 2024, according to Conductor's 2025 State of SEO report. That's a substantial share of visitors, but a ranking chart alone can't explain whether those visits helped a business.
Useful SEO reporting metrics separate what people could see, what they clicked, and what they eventually did. A trustworthy report adds another distinction: which changes justify action, which suggest a direction, and which remain estimates.
Table of Contents
Why SEO Reports Mislead Without Shared Definitions
A shop owner opens Search Console and sees improving visibility. Their analytics report shows little movement, while a rank tracker flags falling keywords. Asked whether SEO is working, the marketing manager feels pressure to turn those different readings into a single score.
The problem isn't necessarily bad tracking. It's that the tools answer different questions.
An SEO reporting metric is a counted event or calculated measure with a named source, date range, filters, and a question it can reasonably answer. Without those details, even a technically accurate number can support the wrong decision.
Give every number a job
Think of a shop window. Impressions are people passing the window, clicks are people stepping inside, and conversions are purchases. Average position describes where the window sits on the street, not how busy the shop is.
The comparison is simplified, but it prevents a common mistake: treating better exposure as proof of better sales.
Your working report should distinguish these metrics:
- Search visibility: Average position and impressions.
- Search engagement: Clicks and click-through rate.
- On-site activity: Organic traffic and pages per session.
- Business outcomes: Conversions, qualified leads, and revenue.
- Page experience: Core Web Vitals.
Each belongs beside a decision. A visibility problem may call for an indexing check or content revision. A page that attracts relevant visitors but loses them before checkout needs a different investigation.
Reporting rule: A number becomes useful when you can explain what it measures, what it excludes, and what you'll do if it changes.
Keep visibility, engagement, and business value in separate columns. Stakeholders can still get a clear verdict, but that verdict should explain the evidence rather than hide it inside a blended SEO score.
Core SEO Reporting Metrics and What Each One Counts
| Metric |
What it counts |
A sound reading |
Do not treat it as |
| Average position |
Impression-weighted average of the site's topmost result |
Context for where results appeared |
A promise that every keyword ranks at that spot |
| Impressions |
Times a site link appeared in Google results |
Search exposure by query, page, country, or device |
Total search volume, traffic, or revenue |
| Clicks |
Selections from a Google result leading to the site |
Entries from Google Search |
All analytics sessions or later conversions |
| CTR |
Clicks divided by impressions |
Whether shown results earn visits |
Proof that demand grew |
| Organic traffic |
Unpaid-search sessions counted after arrival |
Post-click volume in analytics |
The same number as Search Console clicks |
| Conversions |
Defined actions such as purchases or qualified lead submissions |
Whether visits produced a business outcome |
Proof that SEO caused every sale |
| Pages per session |
Pages viewed during a session |
How deeply visitors browsed |
A rule that more pages means better quality |
| Core Web Vitals |
Field measures of loading, responsiveness, and visual stability |
Whether landing-page templates present experience problems |
A substitute for clicks or revenue |
Read the relevant row before reacting to a rising or falling chart. Google's Search Console performance report groups clicks, impressions, CTR, and average position for a selected period, with query, page, country, and device breakdowns; its definitions also establish that 50 clicks from 1,000 impressions equals a 5% CTR, as explained in Google's performance-report documentation.
That calculation explains why the rows aren't interchangeable. Impressions provide the denominator, clicks provide the numerator, and CTR describes the relationship. A change in either component can move the rate.
Understand the boundaries before exporting
An impression records your site appearing under Google's display rules. It doesn't count every search someone performed for a topic, so you can't use impressions as a direct substitute for keyword search volume.
Average position needs equal care. Google records the topmost result belonging to your site for an impression, then averages the recorded positions. If several site results appear together, the highest result supplies the position credited to that impression.
For automated reports, check units as well as labels. The Google guide to Search Console and Analytics explains their different measurement roles; Search Analytics represents CTR as a decimal, so 0.04 means 4%, not the percentage in the earlier calculation.
Define the business-specific rows
Analytics labels need written definitions too. Decide whether a conversion means a submitted form, an accepted sales lead, or a completed order. Those events aren't equally valuable, and counting them together can make weak demand look productive.
For conversion rate, state the denominator. A session-based rate and a user-based rate answer different questions, even when both dashboards label the result conversion rate.
Keep the Search Console fields together in every export. Position supplies ranking context, impressions describe exposure, CTR describes response, and clicks record the resulting entries. Never substitute improvement in one for improvement in all.
How Average Position and CTR Mislead Teams
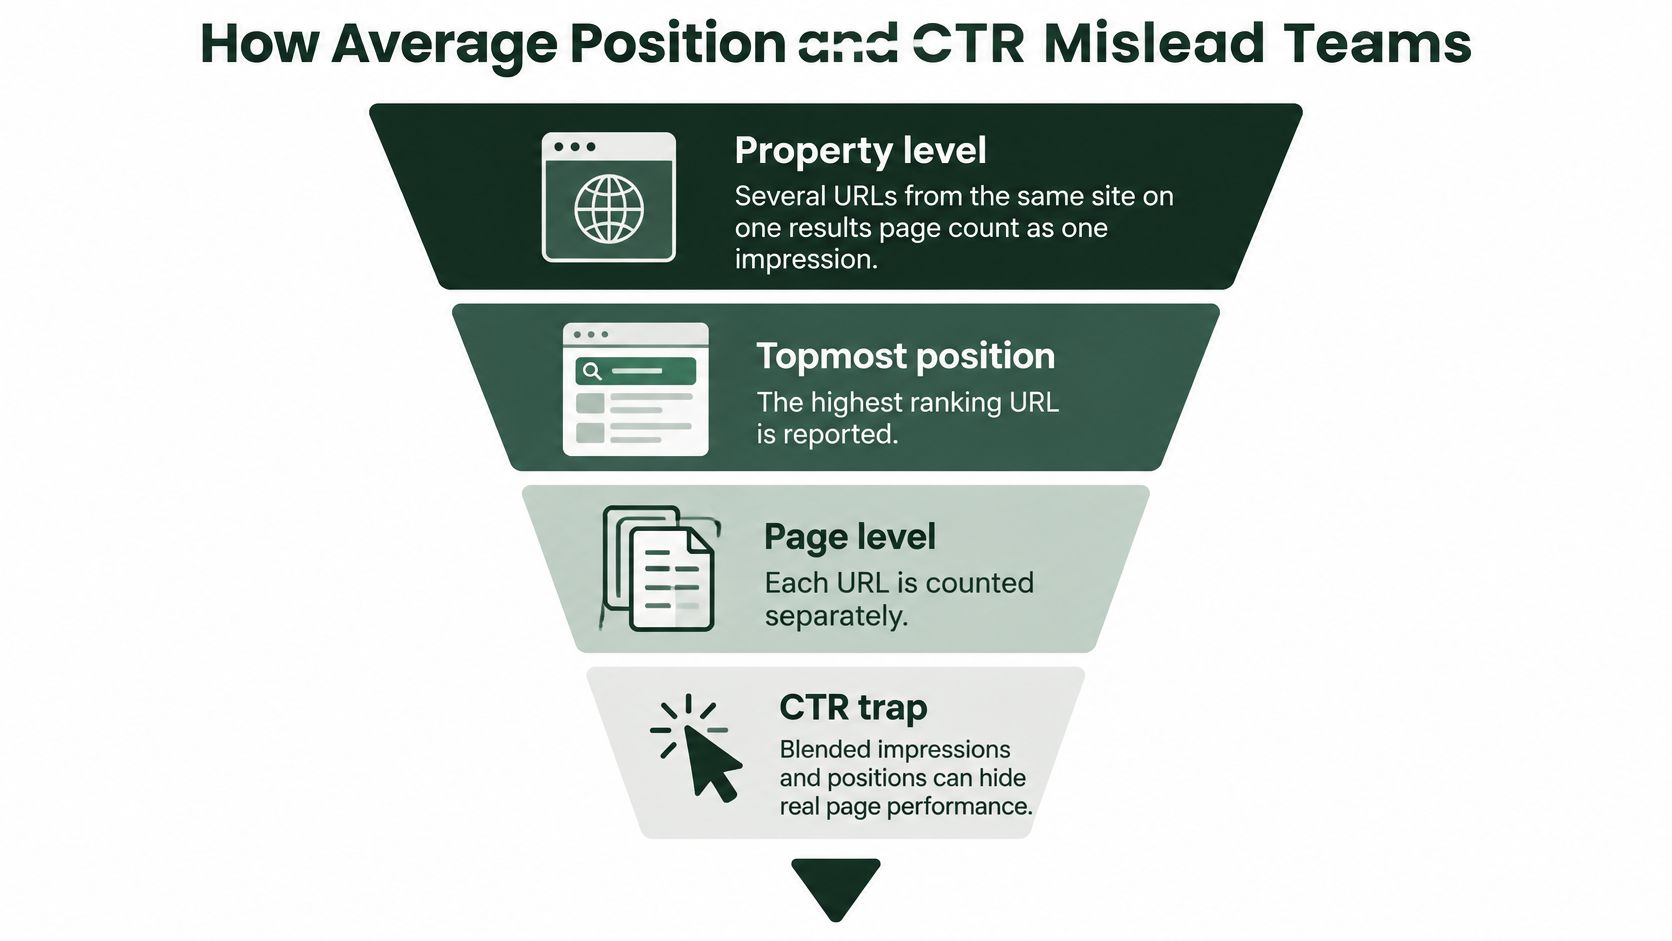
Google documents an aggregation example in which one click across three URLs produces 100% property-level CTR but 33% when impressions are aggregated by page, in its guide to performance-report aggregation. The visitor's behavior hasn't changed. The reporting scope has.
At property level, repeated results from the same site on a results page count together, and Google uses the topmost position. Page-level aggregation counts the unique URLs separately. A stronger property reading therefore doesn't establish that every ranking page became more appealing.
The distinction is easier to follow when you separate the aggregation stages.
Check what changed inside the average
Use page-level data when evaluating a title, snippet, content update, or internal-link change. Use the property view for the overall site reading, without assuming that its averages describe individual URLs.
CTR can also improve without any increase in demand:
- Query mix changed: More branded searches can alter the blended rate even if non-branded performance stays weak.
- Device mix changed: A different balance of mobile and desktop impressions can move the total.
- Low-CTR exposure disappeared: Removing weak impressions can improve the rate while reducing overall reach.
- Results-page presentation changed: Rich results and other search features can change click behavior without an edit to your copy.
These are reasons to investigate, not automatic explanations. Check which mechanism fits the affected pages and queries before choosing a fix.
Compare matching groups
A useful comparison holds the landing page, query group, country, and device steady. Otherwise, you might compare a mobile-heavy informational audience with a desktop-heavy branded audience and mistake the difference for a successful title test.
Position deserves the same treatment. It's recorded when an impression happens, not for every query where you hoped to appear. A changing average can reflect a changing set of appearances rather than a uniform ranking gain or loss.
Before approving a win: Ask whether the improvement survives a page-level comparison with matching filters.
A practical keyword ranking reporting workflow should preserve those filters alongside its charts. If the apparent improvement disappears when you isolate the edited URL, the evidence doesn't support crediting that edit.
Traffic Conversions and Core Web Vitals After the Click
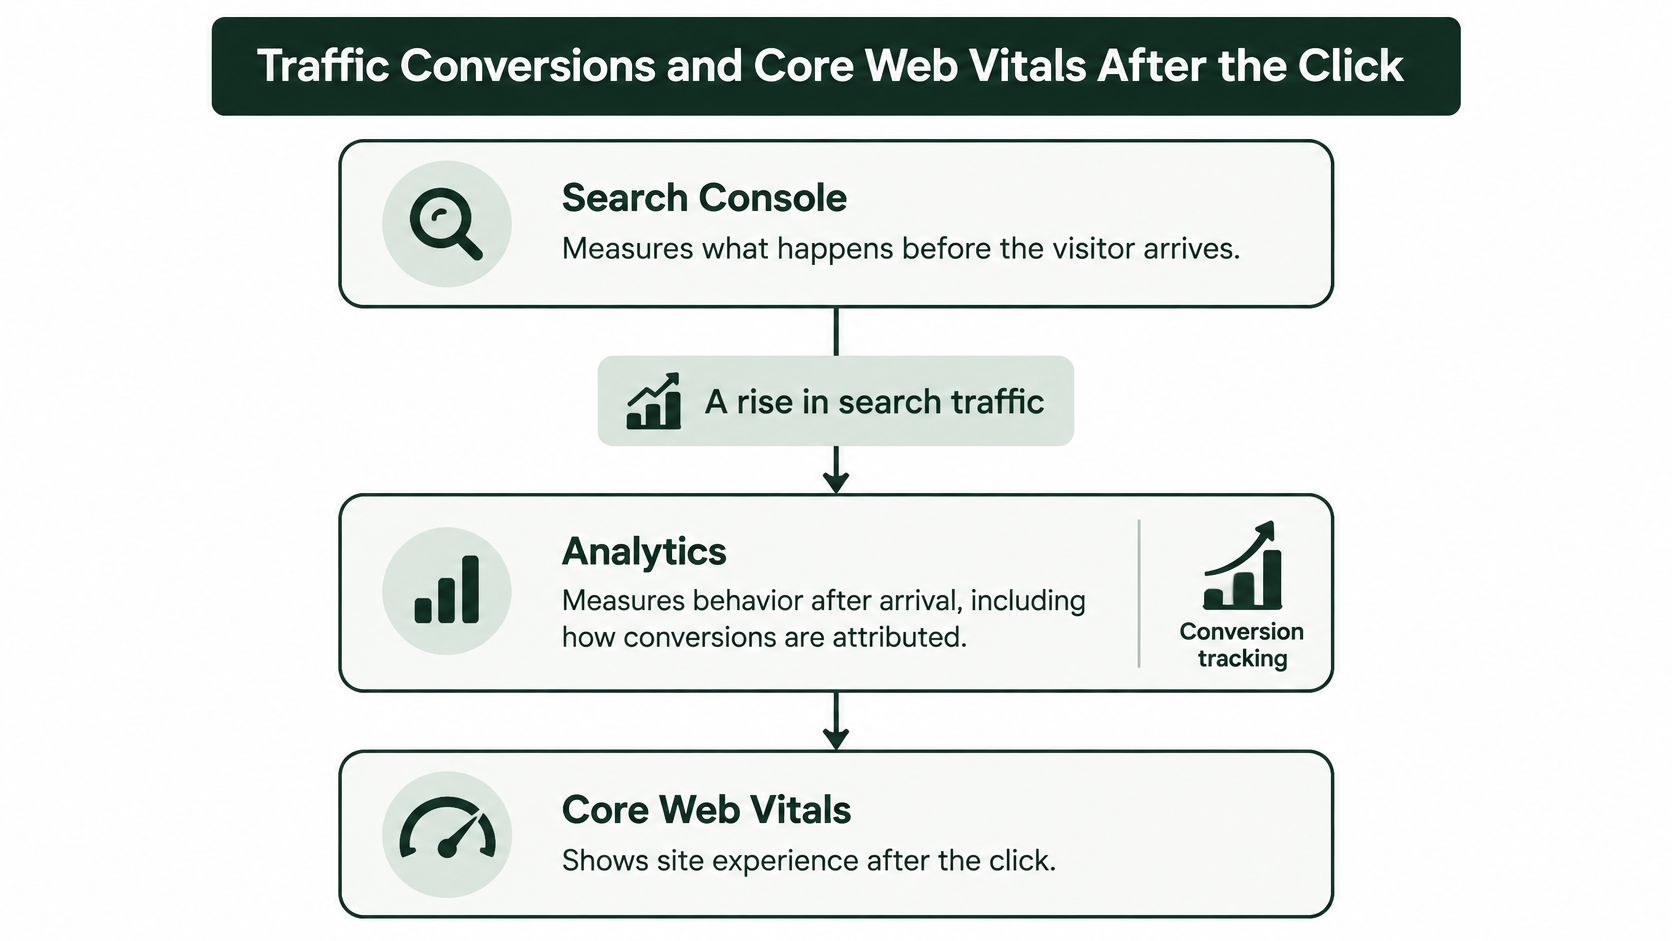
Search Console describes search activity before arrival. Analytics describes what visitors do after arrival and how conversion credit is assigned. Google's comparison of Search Console and Analytics makes that boundary important: a click is an entry event, not evidence of an engaged visit or a sale.
Use a connected sequence: impressions → clicks → engaged sessions or landing-page actions → qualified leads or revenue. A break at each stage suggests a different investigation, so keep the stages visible rather than replacing them with a traffic total.
This diagram separates the measurement roles.
Judge conversions against a relevant baseline
In Q4 2024, the average conversion rate across all countries, platforms, and industries was 4.8%, according to Search Engine Land's conversion-rate benchmarks. That's broad context, not a quota for an individual store or lead-generation site.
A better operational comparison is the changed landing-page group against its own earlier performance. Keep the conversion definition consistent and annotate seasonal promotions, stock shortages, pricing changes, and checkout releases. Otherwise, you may credit an SEO edit for a change caused elsewhere.
Pages per session adds context, but it isn't a quality score. Someone reading a support answer may finish successfully without opening another page. A buyer comparing products may need deeper navigation before purchasing.
Attach experience measures to the landing pages
Core Web Vitals cover Largest Contentful Paint, Interaction to Next Paint, and Cumulative Layout Shift. Use field readings to investigate loading, responsiveness, and layout stability on the templates that receive organic visitors.
Keep the scope practical:
- Category pages: Check whether filters, product grids, or promotional banners disrupt the experience.
- Product pages: Examine large imagery, variation selectors, and purchase controls.
- Editorial pages: Look for intrusive embeds, shifting media, or slow interactive elements.
A homepage lab test doesn't describe every category or product template. Keep lab diagnostics available for debugging, but don't present them as a replacement for real-user field measurements.
Use a targeted Core Web Vitals improvement workflow when an affected template needs repair. In the report, retain Search Console clicks as the search-entry measure and attach analytics outcomes and experience readings to the corresponding landing pages.
That pairing gives the team a concrete question: Did the visitors who reached these pages complete the intended action, and did the page experience obstruct them?
When Search Console and Analytics Disagree
Disagreement doesn't automatically mean a tool is broken. Google's Search Console data documentation describes limitations including sampled URL data, omitted queries, stored top rows, processing, and aggregation differences. A precise-looking chart can still provide an incomplete view.
Start reconciliation with the question each source can answer. A rank tracker follows a selected keyword list. Analytics follows measured on-site activity. Neither should be expected to reproduce Search Console's impression-based view.
Which source can answer which SEO question
| Source |
Best question |
Hard limit |
Confidence label |
| Search Console |
Did Google show the site and send clicks? |
Coverage limits, omitted queries, top-row storage, processing, and lag |
Actionable for exposure when filters match |
| Analytics |
What did measured visitors do after arrival? |
Tracking coverage, session rules, and attribution choices |
Actionable for measured on-site behavior, not rank |
| Rank tracker |
Did selected keywords move? |
Chosen terms aren't full demand or an impression-weighted site average |
Directional unless supported by actual exposure |
| CMS or sales data |
Did search-associated visits produce pipeline or revenue? |
Needs a reliable connection between acquisition and recorded outcomes |
Required to substantiate a financial claim |
The sales connection deserves explicit attention. In 2025, 31.8% of 170 surveyed U.S. marketers connected organic growth reporting to pipeline or revenue, according to Omniscient Digital's organic-growth study. A reporting habit, however common, isn't a measurement limitation: your task is to make that connection defensible.
Label the confidence, not just the movement
Use a practical confidence model rather than treating every percentage change as equally reliable.
- Actionable: A coherent change appears at page or topic level, comparable dates and filters are aligned, and the baseline includes relevant annotations. There's enough evidence for a proportionate intervention.
- Directional: The movement is visible, but suppressed queries or incomplete coverage limit precision. Investigate or run a reversible test rather than make a firm financial claim.
- Estimate: The conclusion rests on an isolated tool reading, a narrow query sample, or mismatched attribution windows. Resolve the mismatch before presenting it as a result.
Record timezone, reporting lag, attribution window, and reconciliation status beside the sources. You don't need to force every total to match. You need to explain the gap well enough that it won't mislead the decision-maker.
For long-tail growth, group pages into topic clusters and compare landing-page outcomes. Maintain branded and non-branded segments where the visible queries allow it, while acknowledging that hidden queries prevent a complete split.
Financial claims require conversion or revenue evidence. Rank changes and impression changes remain visibility findings until that connection exists.
A Three Month Report Read the Right Way
Say a retailer expands its category content and reviews the following quarter. The first report shows wider search exposure, little change in clicks, and a falling property CTR. The owner asks whether the new content failed.
The analyst starts with the landing pages rather than issuing a verdict from the site total.

Separate expansion from deterioration
During the opening month, the retailer published category explanations that began appearing for broader informational searches. By the following month, those pages had added exposure without attracting many visits. Meanwhile, branded searches remained steady.
The analyst doesn't call this a collapse in demand. The new appearances changed the audience included in the total, so the report separates the expansion pages from established commercial pages.
Within the commercial group, a category URL shows weaker click response for comparable queries and devices. Several related URLs also appear for overlapping searches, making the site-wide view less useful for diagnosing that page.
The proposed action is specific: revise the category title to match its actual product selection and strengthen relevant internal links. The analyst records this as a testable diagnosis, not proof that the title caused the decline.
The report's conclusion is a page-level intervention, not a claim that the entire SEO program succeeded or failed.
Keep the remaining evidence in its own lane
Analytics records fewer organic sessions than Search Console clicks. The analyst flags the difference for tracking reconciliation instead of calling it lost rankings. Conversion performance on the repaired template is compared with its own prior-period baseline, with merchandising changes recorded beside the comparison.
The retailer also receives AI referrals. An Ahrefs analysis of approximately 82,000 websites found that AI visitors viewed four pages on average, 1.2 fewer than search visitors, and were 4.1% more likely to bounce. Those findings don't establish the quality of this retailer's visitors; they show why page depth alone is an insufficient verdict.
The report therefore separates brand mentions, source citations, referral visits, and conversions. The analyst groups referrals by landing page and intent, then checks qualified actions and assisted conversions before recommending more investment.
Use this additional reporting walkthrough alongside your own landing-page comparisons.
A credible SEO and ROI assessment preserves these distinctions instead of assigning sales value to every appearance. The retailer's decision is to refresh the weak category URL, maintain separate branded and non-branded views, and judge the AI cohort by its contribution to qualified outcomes.
The report ends with an owner, a scheduled edit, and a comparison to rerun after the change.
Build an Actionable SEO Report This Week
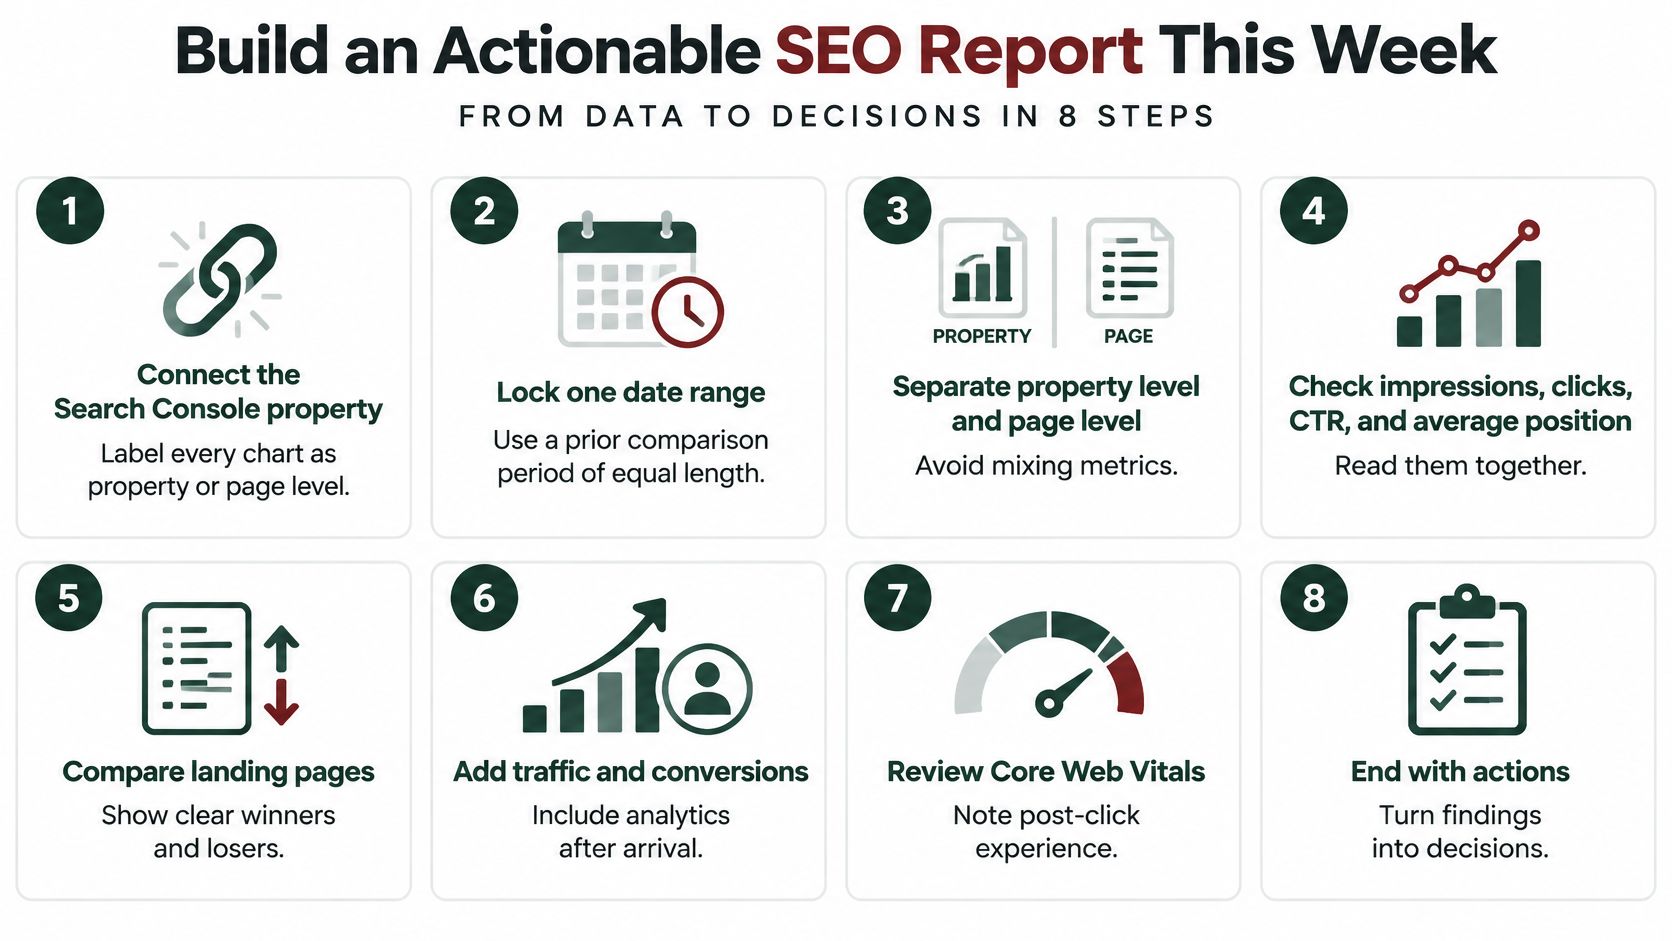
Build the report around decisions you can repeat, not charts you can collect. A shared spreadsheet is enough to establish the definitions and comparison rules before you automate them.
Assemble the evidence
Connect the Search Console property. Label every export and chart as property-level or page-level. Keep the scope visible so a stakeholder won't compare unlike totals.
Lock the reporting dates. Choose a prior comparison period of equal length and record timezone differences. Exclude incomplete reporting days from decisions that require settled totals.
Export the Search Console fields together. Place clicks, impressions, CTR, and average position beside organic sessions, but retain separate source labels. Don't overwrite a discrepancy to make the columns agree.
Add landing-page outcomes. Include conversions and pages per session for the same URLs. Write the conversion definition beside the report, including whether it represents an initial submission or a qualified outcome.
Record field Core Web Vitals. Group affected landing pages by template so a developer can identify a shared component rather than chase isolated URLs.
Check the audience mix. Separate brand from non-brand where possible, then examine country and device before treating a blended CTR movement as evidence of an improvement.
Annotate the comparison. Record releases, indexing changes, seasonal events, and relevant algorithm updates. An annotation supplies context, not automatic proof of causation.
Choose the next action. Select the weakest meaningful page-level finding, assign an owner, and label the evidence actionable, directional, or estimate. State what you'll check after the intervention.
Use the checklist to keep the recurring review consistent.
Publish a report someone can use
The finished document needs distinct blocks for visibility, engagement, value, and the next action. Put confidence labels beside the findings, not in a footnote that readers may miss.
If you want to repeat the review on a schedule, AutoSEO is an optional way to assemble the recurring report. Keep your definitions and decision rules intact regardless of how you collect the numbers.
Publish the report this week and schedule the selected page fix. A named action with a measurable follow-up is more useful than another chart showing movement nobody can explain.
Our Reports dashboard can assemble a shareable report from Search Console totals, stored keyword rank history, published articles, sampled AI prompt checks, and cached site scores. Visit AutoSEO to connect reporting with a workflow in which rankings, indexed pages, AI citations, clicks, and traffic signals inform the next SEO decision.